
Our Role: UX Product Design and Research
The Context
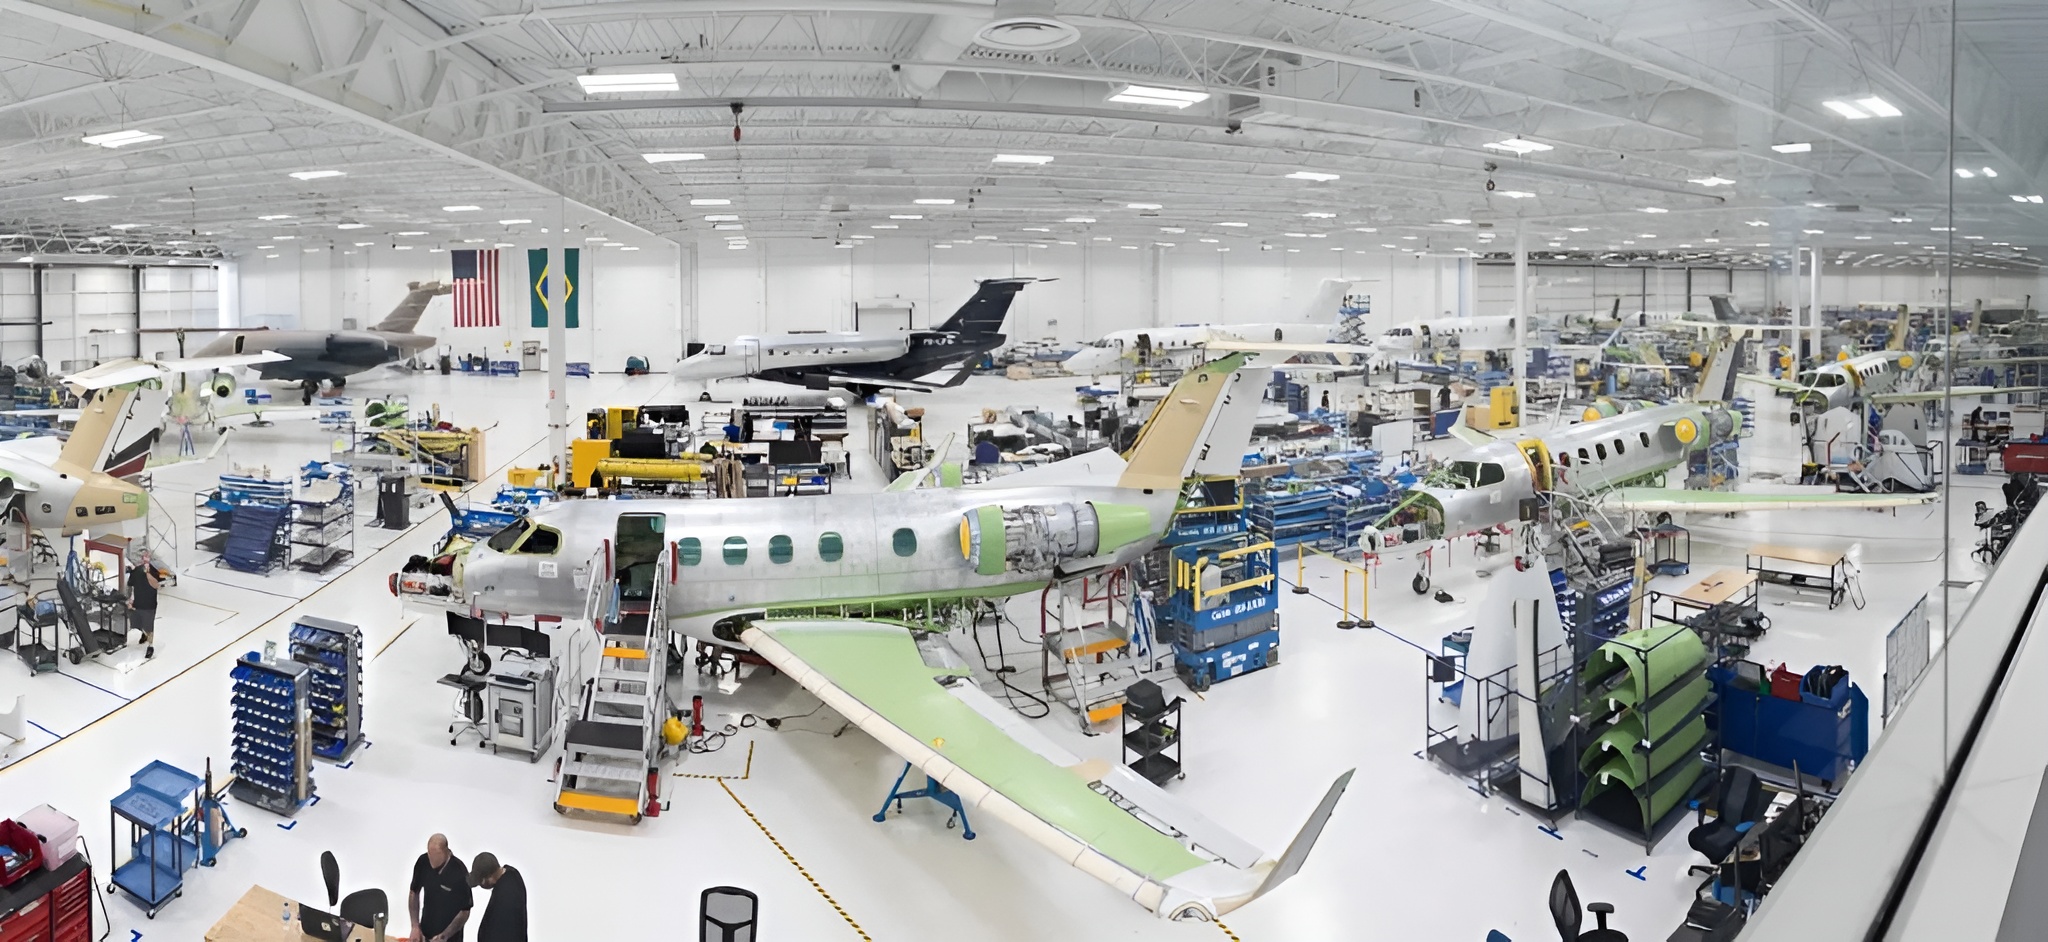
The Parts Repair department of one of the top three largest aircraft manufacturers in the world wants to develop an Aircraft Parts Repair Optimization System to help reduce costs during repair negotiations. They currently spend around US$100 million a year (as of 2017), and each analyst has around one minute to analyze and negotiate each quote.
The Challenge
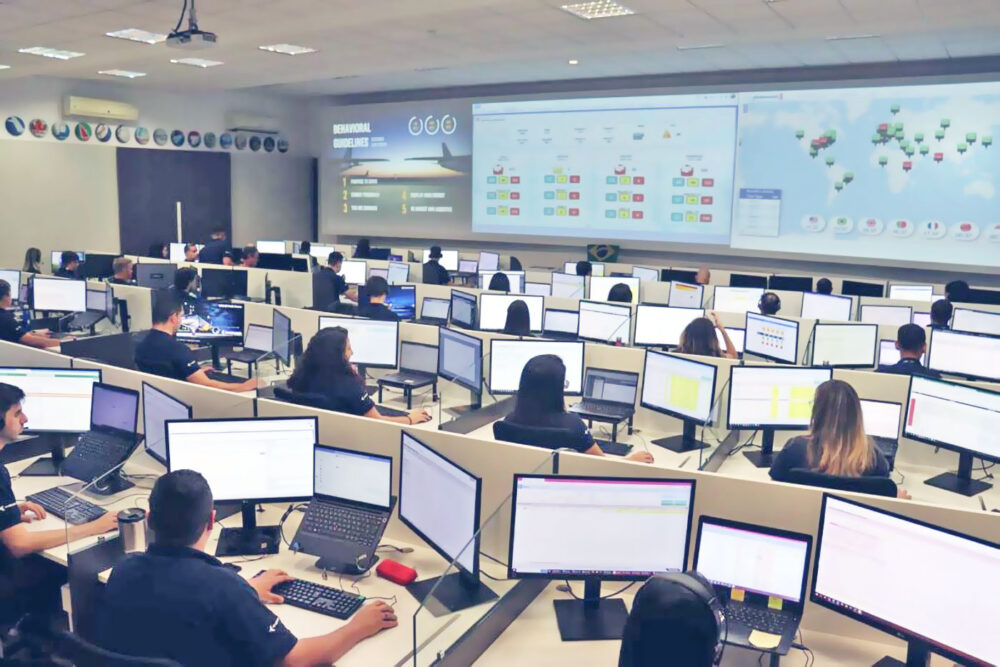
The purchasing analysts faced a high global demand for aircraft part repairs, and due to the lack of historical data on how much they had spent on repairing similar parts, they were at the mercy of suppliers, without any arguments to challenge high prices.
Can we use repair historical data and other database to support analysts in quotation analysis?
Our Process
1. Understand & Frame the Problem
What We Do
- Interviews & Observations: Chat with analysts and shadow them while they work. This is where I listen to their day-to-day negotiation process and see exactly what data they’re eyeballing.
- Context Gathering: Dig into existing reports or purchase histories. Even though they have limited historical repair data available easy, we should at least see what’s there.
- Hypothesis Building: Based on quick findings, form initial theories (e.g., “They need quick price comparisons” or “They need trending and historical repair data on hand”).
Why It Matters
- We get clarity on the real pain points. We’re zeroing in on the challenges of having only seconds to analyze a quote and no good data to back up negotiations.
2. Define the Core User Needs
What We Do
- User Personas: Typically, I’d craft a persona, but here it might be a single type: “The Purchasing Analyst.” Instead of spending time building out multiple personas, we focus on the ‘Jobs to be done’ specifics of their negotiation constraints and success metrics.
- Key Metrics: Let’s figure out what “success” looks like. For instance, is it cutting the cost by a certain percentage, or reducing the analysis time from 1 minute to 30 seconds, or both?
Why It Matters
- Narrowing down the user archetype means we don’t get lost designing features for everyone. We target the real user with real goals.
3. Ideation & Early Concepts
What We Do
- Brainstorming Workshops: Bring together analysts, stakeholders, and a data-savvy engineer. Toss around ideas for the new dashboard.
- Competitive & Analogous Research: Quick look at how other industries handle high-volume quotes and price negotiation dashboards. Borrow what makes sense, adapt it to our unique needs.
- Low-Fidelity Sketches: Rapidly wireframe possible dashboards. We skip pretty mockups initially—pencil sketches or whiteboard scribbles are enough to validate layout and data display.
Why It Matters
- Keeps the process lightweight and collaborative. The emphasis is on concept validation, not high-polish deliverables at this point.
4. Rapid Validation
What We Do
- Prototype: Translate the best ideas into a rough interactive prototype (Axure RP).
- User Feedback Loops: Have the analysts “play” with the prototype. Watch where they hesitate, see how they interpret the data, and note any confusion.
- Iterate or Toss: If a layout or feature flops, we ditch it fast. If it works, we refine.
Why It Matters
- Allows us to fail fast. With minimal investment in each iteration, we can explore multiple ideas, gather feedback, and refine quickly.
Â
The Solution
After conducting interviews and gaining an understanding of the department’s current process, we found that a lack of information during price quotation and negotiation for aircraft part repairs—combined with high demand—prevented analysts from securing better deals. Historical data was stored in an unstructured manner, using Word documents, Excel files, and emails saved on individual employees’ computers.
We mapped and prioritized the key indicators for a new dashboard that would feature real-time data. Then, we pinpointed where the data and KPIs were stored and directed the engineering team to begin restructuring the department’s data in a modern, scalable way.
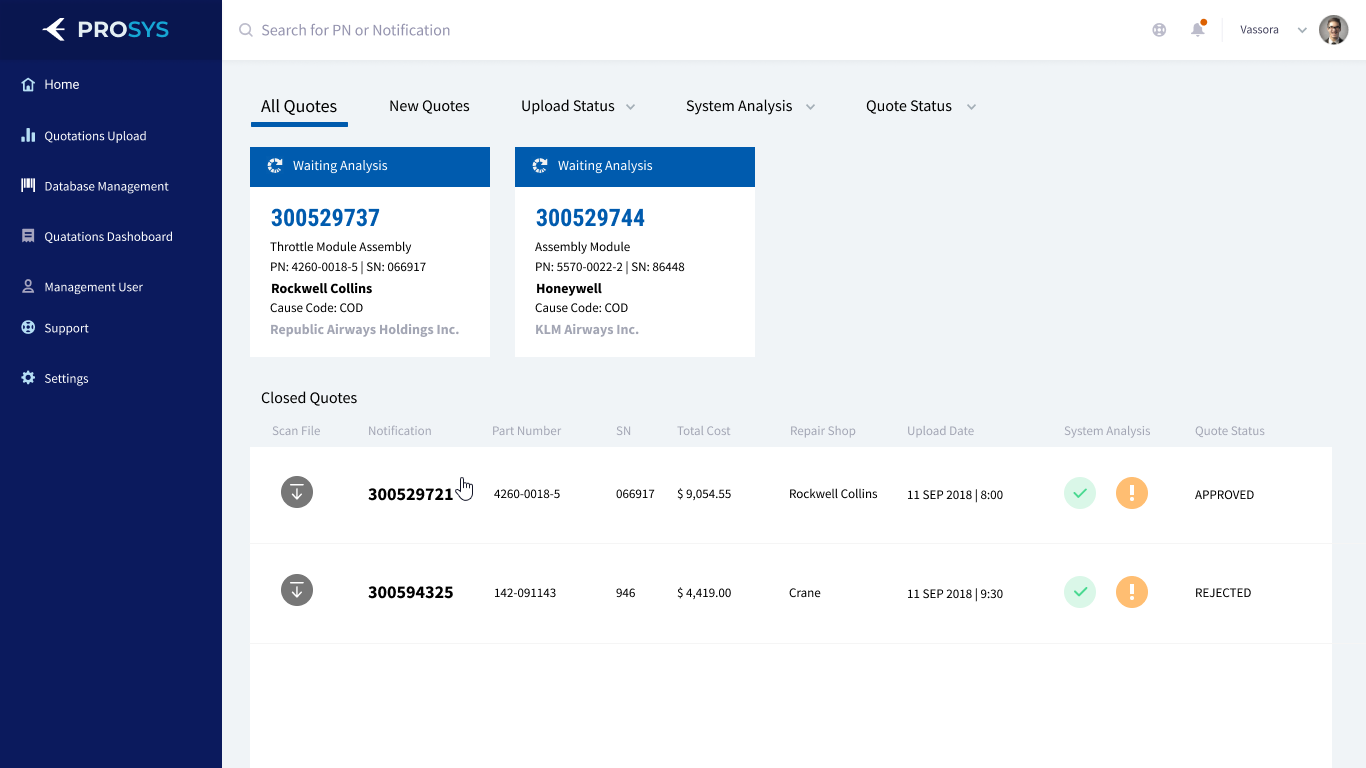
With the data foundation in progress, we set out to create an optimized, user-friendly dashboard that could handle a large amount of data without overwhelming users. We developed three different dashboard versions and presented them to the business unit for evaluation. After a collaborative process of adjustments and prioritizations, we finalized the design showcased here: the initial screen provides an at-a-glance summary of essential information that analysts can use to excel their negotiations.
After the tool was launched, the average repair cost decreased, resulting in US$2 million in savings during the first month alone—enough to covered the initial investment and set us up for millions more in savings over the coming months and years.
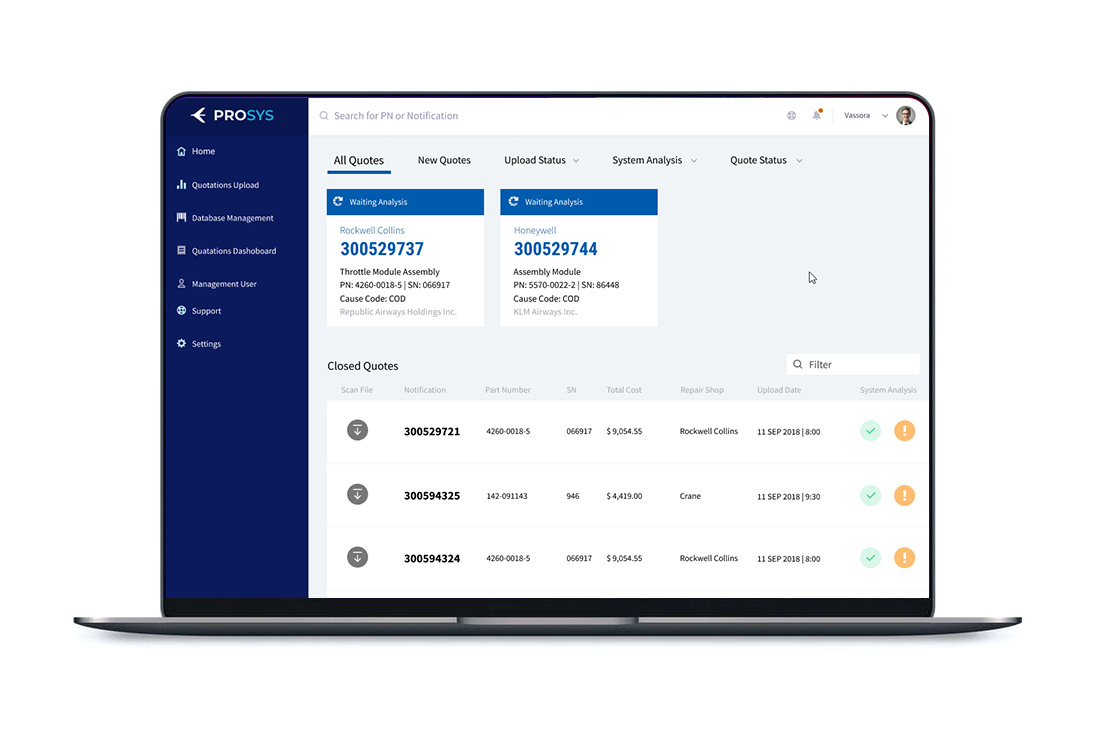
Initial Interface – A modern quotations list where each card presents the most relevant information.
Â
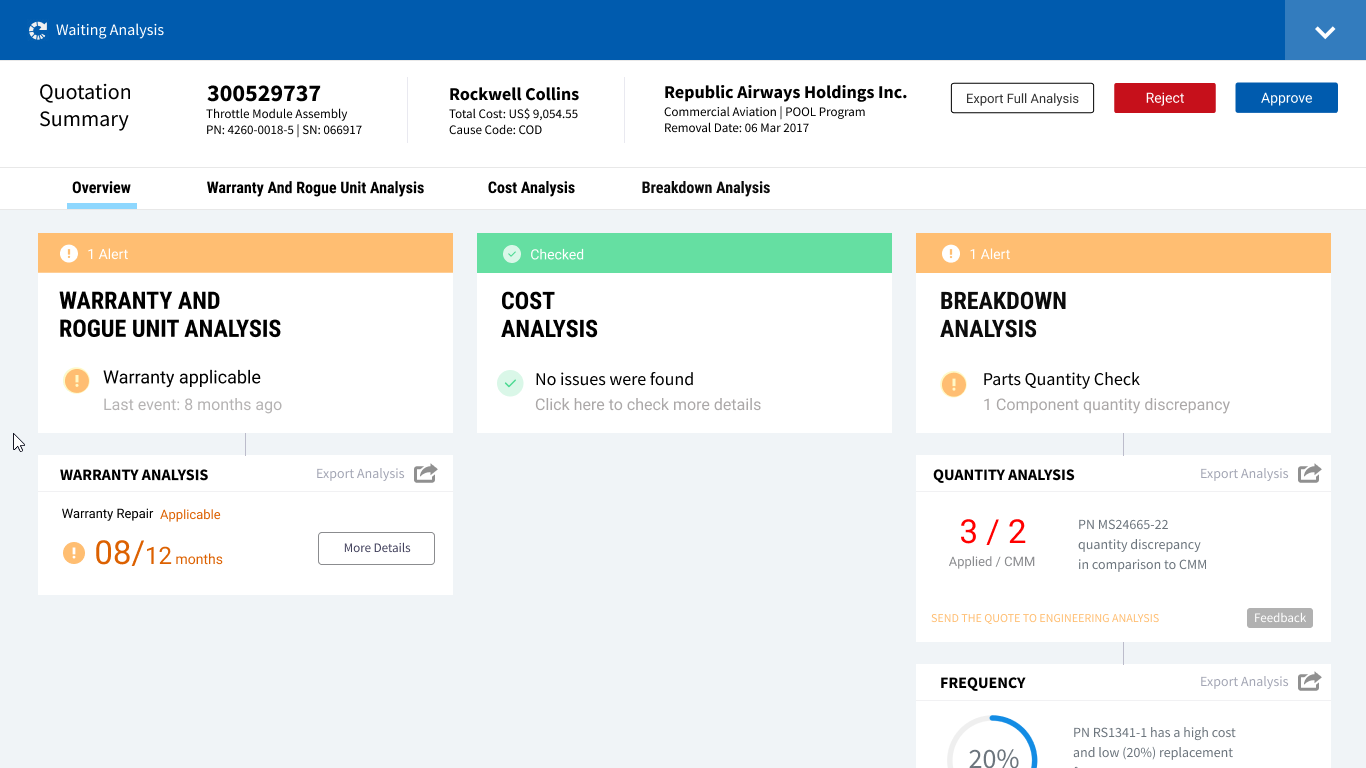
Quotation Details – When an analyst clicks on a specific quotation, they’re taken to a Details page that shows a summary of the most relevant indicators. We use a yellow banner to highlight alerts, offering key insights that help analysts negotiate more effectively.
Â
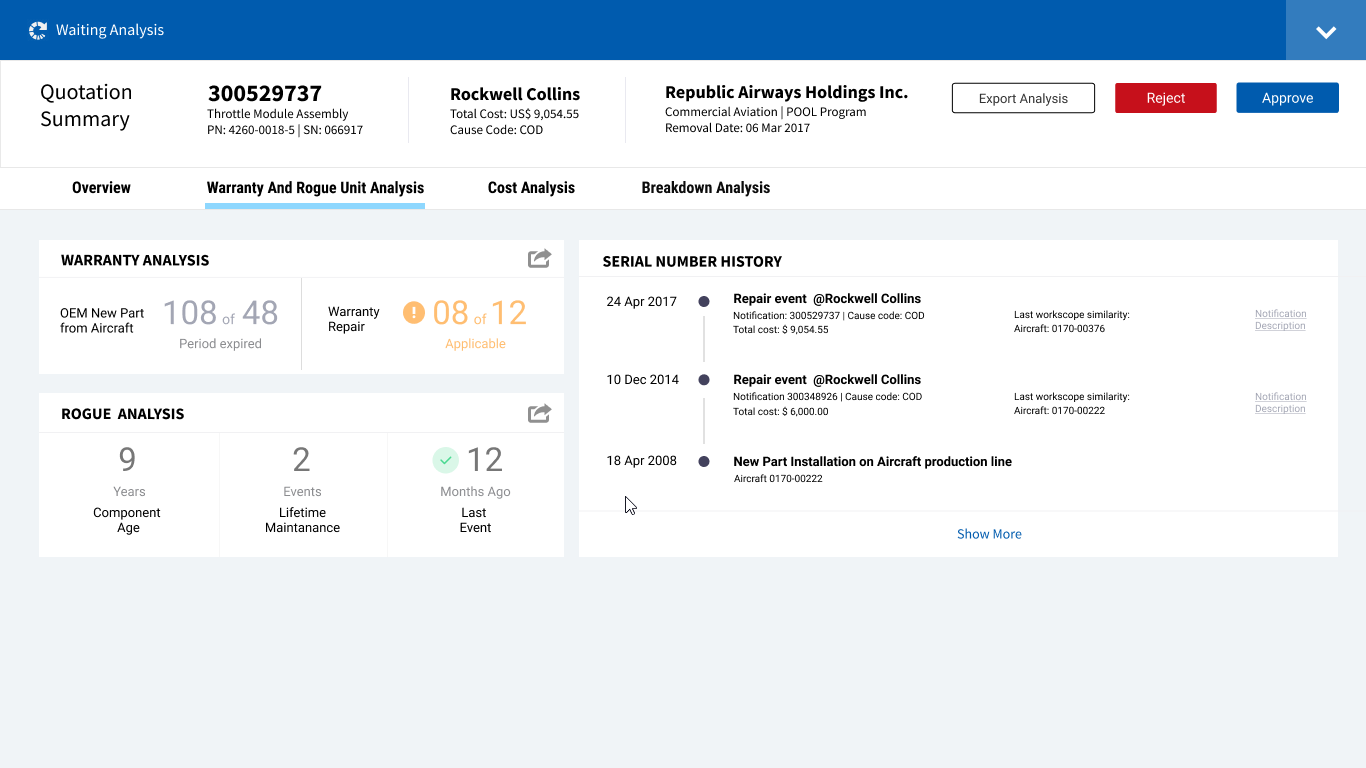
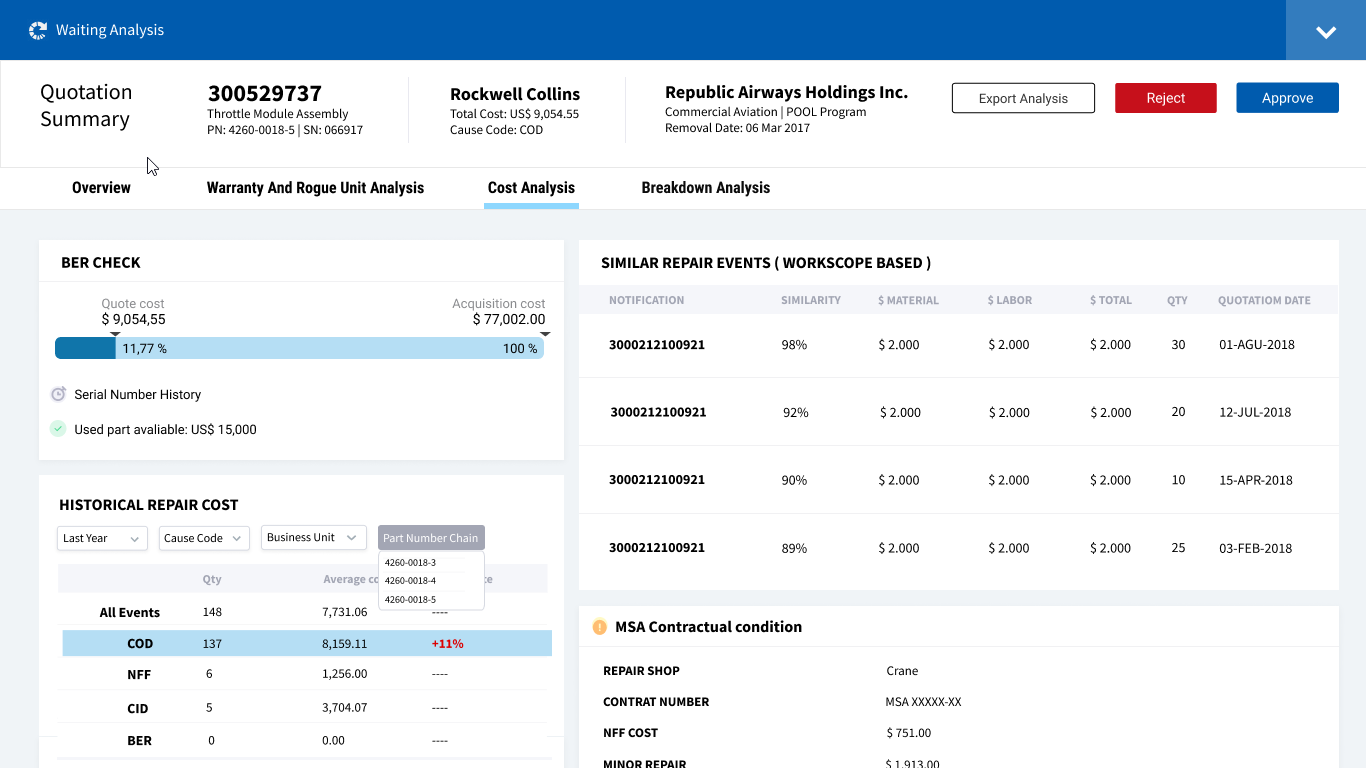
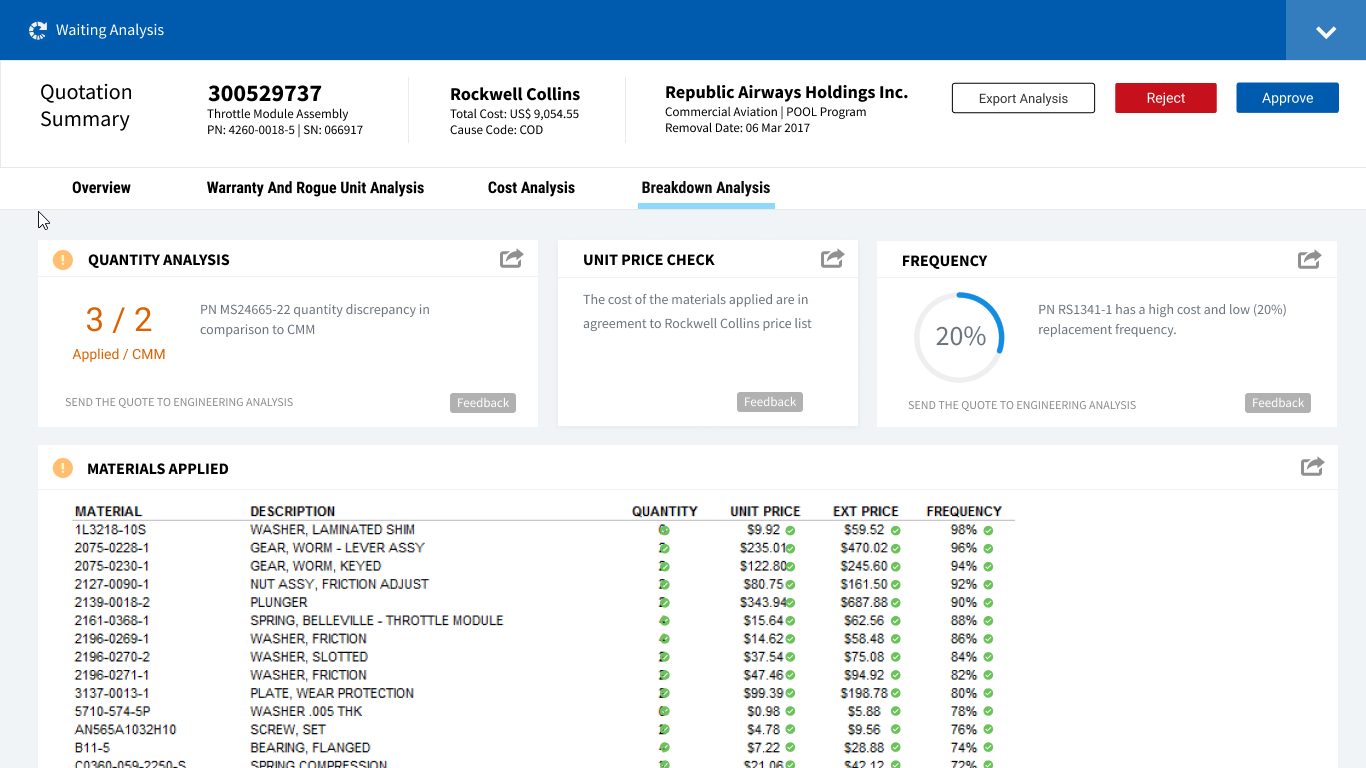
Quotation Deep Dive: When users click on the alert banner, they can explore detailed historical data and relevant insights.
Â
Â
Â
Breakdown Analysis
Â